Dashboard Widget
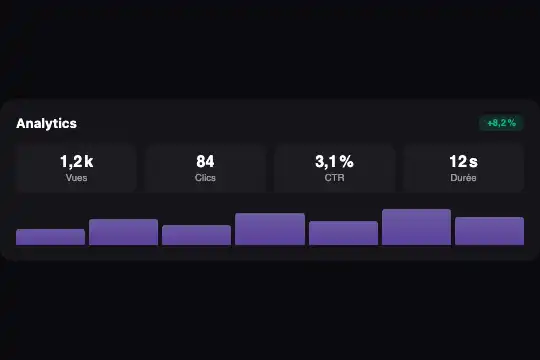
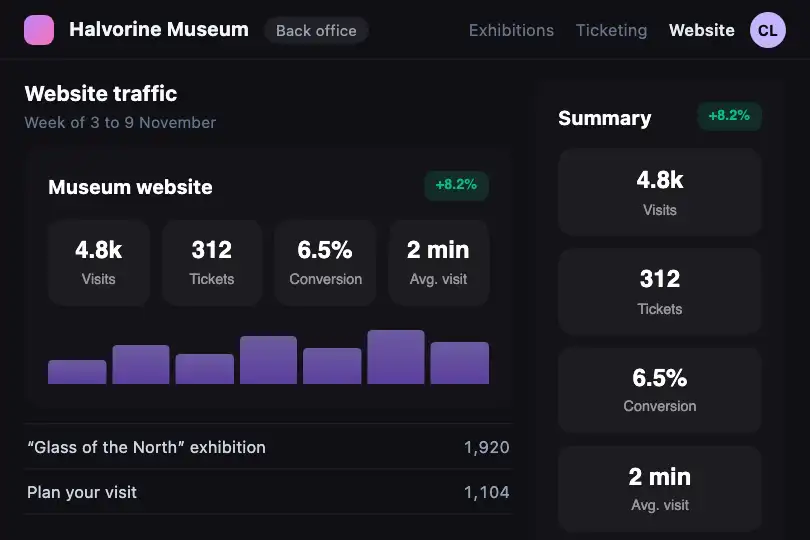
Figures widget that reads the width of its own slot: stacked when narrow, two columns next, then one row with a mini bar chart from 300 px.
Updated
This effect is part of Effect.Labs — 840 vanilla effects, some free, some premium. Utilities has 43 effects, including 3 free. Explore the category →
3 usage examples
How it works
The .fx-0748-root root declares itself a container (container: dwg / inline-size) and takes the full width of its parent. The @container dwg rules compare that width with two thresholds; the browser window never comes into it. The same widget can therefore show wide in the main content and narrow in a side column of the same page.
Below 240 px, the four figures in .dwg-stats stack in one column. From 240 to 299 px they form a two-by-two grid. From 300 px they line up in four columns and the .dwg-chart row (seven bars whose height is written as style="height:…%") appears under the figures.
No JavaScript: everything lives in the CSS. The layout change is instant (a column count is not interpolated) and nothing moves continuously, so the widget is unaffected by the “reduce motion” setting.
Accessibility
- Real text: title in an
<h4>, each figure and its label are text read in order (value then label). Adjust the heading level to your page. - Decorative chart:
.dwg-chartcarriesaria-hidden="true"because its bars have neither values nor legend. If they carry information, add a text summary next to the widget. - Contrast: labels in 55 % white on
#0a0a0f, figures in pure white; the green#10b981badge on its tinted background stays readable at small size. - Keyboard and touch: nothing to activate, the widget has no interactive element. The column change comes from width, so it behaves the same with a finger or a mouse.
- Motion: no transition or animation in the code, nothing to switch off under
prefers-reduced-motion.
Browser compatibility
CSS-only container queries (Chrome 105, Firefox 110, Safari 16 according to @mdn/browser-compat-data 8.1.8). Measured in Chromium 151, Firefox 153 and WebKit 26.5: 1 column at 200 px, 2 columns at 250 px, 4 columns plus chart at 300 and 600 px; no overflow on a 390 px page; two copies side by side each keep their own layout.
A browser without @container keeps the base layout: stacked figures, chart hidden. The content stays complete and readable.
The code
HTML structure to paste into your page (the CSS + JS come with your purchase):
<div class="fx-0748-root">
  <div class="dwg-card">
    <div class="dwg-head"><h4>…</h4><span class="dwg-badge">…</span></div>
    <div class="dwg-stats">
      <div class="dwg-stat"><span class="dwg-stat-val">…</span><span class="dwg-stat-label">…</span></div>
      <!-- 4 figures -->
    </div>
    <div class="dwg-chart" aria-hidden="true"><span class="dwg-bar" style="height:40%"></span><!-- 7 bars --></div>
  </div>
</div>One-time payment, no subscription — the code is yours forever
Customize
Options passed to the API or data-* attributes:
| Option / property | Default | Effect |
|---|---|---|
Thresholds (CSS — @container dwg (min-width: 240px) and (min-width: 300px)) |
240 px → 2 columns, 300 px → 4 columns + chart | Move both values to suit your labels: a long label needs a higher four-column threshold (360 px for instance). |
Container name (CSS — container: dwg / inline-size) |
dwg |
Rename it in the declaration and in both @container rules if your page already uses that name. |
Figures and labels (HTML — .dwg-stat-val, .dwg-stat-label) |
4 neutral sample figures | Replace them with your values; with three or five figures, also change repeat(4, 1fr) in the 300 px tier. |
Chart bars (HTML — style="height:…%" on .dwg-bar) |
7 bars from 40 to 90 % | Each percentage is a bar's height in a 40 px row; add or remove <span> elements, they share the width. |
Colours (CSS — .dwg-bar, .dwg-badge, background of .fx-0748-root) |
#8b5cf6 → #a78bfa gradient, #10b981 badge, #0a0a0f background |
Change the bar gradient and the badge colour; for a light background, also invert the figure colour. |
Title (HTML — <h4> in .dwg-head) |
“Analytics” | Change the text and, if needed, the heading level; the style follows as long as the tag stays inside .dwg-head. |
FAQ
aria-hidden only if you add text saying what the bars show.