Responsive Chart
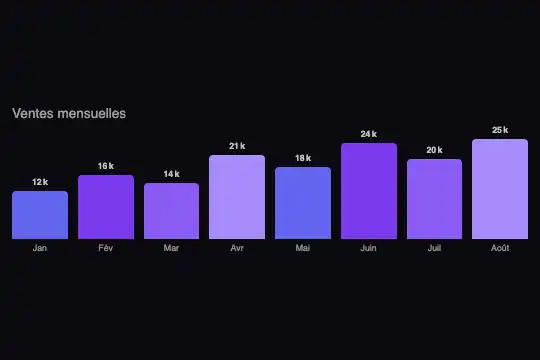
Chart that picks its shape from the width of its slot: a simple line when narrow, a bar chart next, then labelled bars with months and values.
Updated
This effect is part of Effect.Labs — 840 vanilla effects, some free, some premium. Utilities has 43 effects, including 3 free. Explore the category →
3 usage examples
How it works
The .fx-0761-root root is a container (container: rcx / inline-size). Below 300 px, only the .rcx-spark SVG line shows (40 px tall, a 2 px stroke that does not stretch thanks to vector-effect: non-scaling-stroke). From 300 to 449 px, the .rcx-bars bar chart replaces it at 80 px. From 450 px, the bars grow to 100 px and each one shows its month below and its value above, with room kept by an 18 px top and 16 px bottom margin.
The data lives in the bars: data-value for the number, .rcx-bar-label and .rcx-bar-value for the displayed text. On load, each root's script reads those numbers back, recomputes every bar height against the tallest, redraws the line with the same values and rewrites the aria-label summary. Changing one bar is enough to keep the three shapes in agreement.
The shipped HTML already holds the computed heights, line and summary: without JavaScript, the sample chart displays identically. Nothing animates; the shape change is instant.
Accessibility
- Readable summary: the
.rcx-plotarea is arole="img"whosearia-labellists every value (“Monthly sales — Jan 12k, Feb 16k…”), whatever shape is displayed; the title is a real<figcaption>. - Colours: four alternating purples via
:nth-child(4n…); they give visual rhythm and encode no data, so no information depends on colour. - Small sizes: months and values at 0.55 rem; for a broad audience (older readers, a screen seen from afar), go up to 0.7 rem and raise the labelled tier accordingly.
- No interaction: nothing on hover, nothing to reach with the keyboard; the chart is read, not operated.
Browser compatibility
Container queries (Chrome 105, Firefox 110, Safari 16 according to @mdn/browser-compat-data 8.1.8), SVG and a few lines of JavaScript. Measured in Chromium 151, Firefox 153 and WebKit 26.5: line at 200 px, bars at 320 px, months and values intact below and above the bars at 460 and 640 px; two charts with different data on one page each keep their own line.
Without @container, only the line shows, at any width. Without JavaScript, the heights, line and summary written in the HTML stay those of the sample: update them by hand if you change the data.
The code
HTML structure to paste into your page (the CSS + JS come with your purchase):
<div class="fx-0761-root">
  <figure class="rcx-chart">
    <figcaption class="rcx-title">…</figcaption>
    <div class="rcx-plot" role="img" aria-label="…">
      <svg class="rcx-spark" viewBox="0 0 200 40" preserveAspectRatio="none" aria-hidden="true">
        <polyline class="rcx-spark-fill" points="…"/>
        <polyline class="rcx-spark-line" points="…"/>
      </svg>
      <div class="rcx-bars" aria-hidden="true">
        <div class="rcx-bar" data-value="12" style="height:48%"><span class="rcx-bar-label">Jan</span><span class="rcx-bar-value">12k</span></div>
        <!-- one bar per month -->
      </div>
    </div>
  </figure>
</div>One-time payment, no subscription — the code is yours forever
Customize
Options passed to the API or data-* attributes:
| Option / property | Default | Effect |
|---|---|---|
Data (HTML — data-value, .rcx-bar-label, .rcx-bar-value) |
8 months from 12k to 25k | Change the number in data-value and both texts; the script recomputes heights, line and summary. Add or remove bars freely. |
Tiers (CSS — @container rcx (min-width: 300px) and (min-width: 450px)) |
Line, bars at 300 px, labelled bars at 450 px | With twelve months, raise the labelled tier (around 560 px) so the labels do not touch. |
Bar colours (CSS — .rcx-bar:nth-child(4n+1) to (4n)) |
#6366f1, #7c3aed, #8b5cf6, #a78bfa |
One colour for a sober chart, or highlight the latest month with .rcx-bar:last-child. |
Line (CSS — .rcx-spark polyline, .rcx-spark-fill) |
2 px #6366f1 stroke, 15 % area |
Remove the fill (fill: none on .rcx-spark-fill) for a bare line; the stroke keeps its thickness at any width. |
Heights (CSS — .rcx-bars { height } per tier, .rcx-spark { height }) |
Line 40 px, bars 80 then 100 px | Keep the labelled tier's margin (margin: 18px 0 16px): it is what leaves room for values and months. |
Title (HTML — <figcaption class="rcx-title">) |
“Monthly sales” | The title also opens the summary read by screen readers. |
FAQ
data-value and the script draws the line with the same proportions as the bars. The points written in the HTML only matter when JavaScript is off.style.height directly (the line and the spoken summary will not follow).